Mastering customer churn analysis means identifying, predicting, and reducing customer loss by analysing experience, behavioural, and operational data. By combining churn analysis with AI-driven predictive models and customer health scores, companies can proactively detect churn risks, personalise retention interventions, and measure success through clear CX and revenue-focused KPIs.
Customer churn is one of the most critical indicators of business health, and one of the hardest to manage without the right data, tools, and strategy. While most companies track churn at a high level, far fewer truly master customer churn analysis in a way that enables proactive retention and measurable business impact.
In this article, we explore what customer churn really means, why it matters, and how companies can use churn analysis, predictive analytics, and AI-driven insights to reduce customer loss. We’ll also look at practical steps, KPIs, and real-world examples that show how churn reduction can move from theory to results.

Get a First-Hand Experience Today!
Staffino is the perfect tool for creating engaging surveys, tracking performance, responding to customer feedback, and rewarding top employees. Get started today with our FREE demo!
What Is Customer Churn and Why Is It So Important?
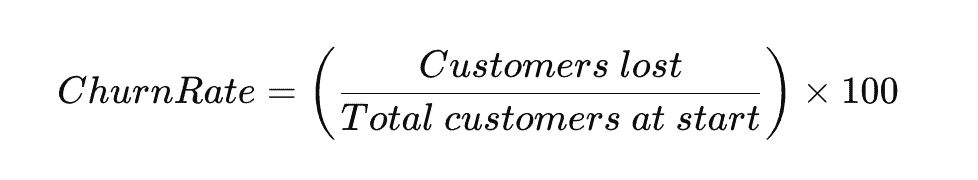
Customer churn refers to the percentage of customers who stop doing business with a company during a specific period of time. Customer churn analysis goes beyond measuring that number. It focuses on understanding why customers leave, when they are likely to leave, and what actions can prevent it.
Churn has a direct impact on:
- Revenue stability and growth
- Customer lifetime value (CLV)
- Acquisition costs and marketing efficiency
- Brand perception and long-term competitiveness
Multiple studies show that acquiring a new customer is significantly more expensive than retaining an existing one. This makes churn analysis not just a CX initiative, but a core business discipline that spans customer service, operations, marketing, and leadership.
For a foundational overview, our article What Is Customer Churn Analysis? provides a strong starting point.
Types of Customer Churn: Voluntary vs. Involuntary
Understanding churn begins with categorisation. Not all churn is created equal, and effective churn reduction depends on identifying the type of churn you are dealing with.
Voluntary Churn

Voluntary churn occurs when customers actively decide to leave. Common reasons include:
- Poor customer experience or unresolved service issues
- Perceived lack of value
- Better offers from competitors
- Lack of personalisation
This type of churn is often predictable and preventable, especially when organisations monitor experience signals in real time.
Involuntary Churn

Involuntary churn happens when customers leave for reasons beyond direct dissatisfaction, such as:
- Payment failures
- Contract expiration
- Account inactivity
- Technical or operational barriers
While less emotional, involuntary churn can still represent a significant revenue loss, and often signals process or system weaknesses rather than CX failures.
For a deeper dive into the root causes, see Top Causes of Customer Churn on our blog.
Key Factors Influencing Customer Churn
Across industries, churn is rarely driven by a single issue. Instead, it emerges from a combination of factors, including:
- Service quality and consistency
- Response time and resolution effectiveness
- Employee engagement and performance
- Customer effort and friction
- Expectation gaps across channels
This is where experience data becomes critical. Traditional metrics like NPS or CSAT provide useful snapshots, but they must be connected with behavioural, operational, and transactional data to reveal churn patterns at scale.
What Data Is Most Important for Churn Analysis?
High-quality churn analysis depends on combining multiple data sources into a single analytical framework. The most effective programmes typically include:
Data Category | Data Type | Why It Matters for Churn Analysis |
Experience Data | Highlights immediate satisfaction levels and early dissatisfaction signals | |
Indicates loyalty and likelihood of advocacy vs. defection | ||
Identifies friction in customer journeys that often leads to churn | ||
Qualitative feedback and verbatim comments | Reveals root causes and emotional drivers behind churn | |
Behavioural & Operational Data | Purchase frequency and recency | Shows declining engagement patterns that often precede churn |
Product or service usage patterns | Detects underutilisation or feature abandonment | |
Support interactions and escalation history | Flags repeated issues or unresolved problems | |
Channel switching behaviour | Signals frustration or a lack of a seamless omnichannel experience | |
Employee & Process Data | Connects service quality and employee actions to churn outcomes | |
Training completion and engagement | Indicates the readiness of teams to deliver consistent experiences | |
Compliance with service standards | Ensures operational consistency across teams and locations |
When integrated correctly, these data points feed into a customer health score, a composite indicator that reflects the likelihood of retention or churn for each customer.
How Do You Predict Customer Churn Using AI?
Predictive churn analysis is where data becomes actionable. Rather than reacting to churn after it happens, organisations can use AI-driven predictive models to identify at-risk customers early.
Predictive Models in Customer Churn Analysis
AI models analyse historical patterns across thousands or millions of interactions to:
- Detect early warning signals
- Assign churn probability scores
- Segment customers by risk level
- Identify key churn drivers
These models continuously learn and adapt as new data is added, making them far more accurate than static rule-based approaches. Our article on Predictive Analytics in Customer Experience explains how predictive models transform CX management from reactive to proactive.

Let AI Handle the Heavy Lifting in CX
With Staffino’s AI, you can respond with empathy at scale, understand customer feedback faster, boost upsell, and make smarter decisions with almost no effort.
From Insight to Action: How to Analyse and Reduce Churn
Data alone does not reduce churn. Action does. The most successful churn reduction programmes follow a structured approach:
1. Identify High-Risk Customers Early
Use predictive scores and customer health metrics to flag customers before dissatisfaction escalates.
2. Design Targeted Interventions
Different churn drivers require different responses:
- Proactive outreach from customer service teams
- Tailored offers, customer loyalty programs, and incentives
- Personalised communication based on behaviour and preferences
3. Empower Frontline Teams
Retention is often won or lost at the frontline. Real-time insights help employees:
- Understand customer context instantly
- Prioritise high-risk interactions
- Deliver consistent, high-quality service
4. Close the Feedback Loop

Churn analysis should continuously close the loop and inform:
- Process improvements
- Training and coaching programmes
- CX and retention strategy
Our Customer Retention Management Strategies Guide provides additional tactical frameworks for these steps.
Get Actionable Insights with Closed Loop Feedback Management
With Staffino, you'll never leave a customer unhappy again! Streamline the process of collecting and responding to feedback, identify areas of improvement, and make sure that customer issues are addressed quickly and effectively.
Real-World Example: Reducing Churn Through Experience Intelligence
A strong example of churn reduction in action can be found in Staffino’s case study on Orange, one of the world’s leading telecommunications operators. By leveraging real-time customer feedback, predictive analytics, and frontline employee performance insights, Orange was able to:
- Identify annual savings of nearly €200,000
- Pinpoint experience gaps linked to churn
- Improve service consistency across locations
- Strengthen customer loyalty through targeted interventions
This case highlights a critical principle: churn reduction is not a single initiative, but an ongoing, data-driven process.
Thanks to the simplicity of the Staffino platform and the ability to discuss each case internally directly within the online platform, we have been able to retain 70% of customers who were likely to leave.
VLADISLAV KUPKA
BOARD MEMBER, ORANGE
KPIs and Results Reporting: Measuring Churn Reduction Success
To prove impact and secure executive buy-in, churn reduction efforts must be measurable. Key KPIs typically include:
Core Churn Metrics
- Gross and net churn rate
- Customer retention rate
- Customer lifetime value (CLV)
Experience and Health Metrics
- Customer health score trends
- NPS, CSAT, and CES improvements
- Volume and sentiment of customer feedback
Operational and Financial Impact
- Revenue saved through retention
- Cost reduction from fewer escalations
- Performance improvement at the team or location level
Benchmarking these metrics against industry standards is also essential. Our article on Customer Retention Benchmarks by Industry offers valuable reference points.
Turn Customer Churn Analysis into a Competitive Advantage
In a market where customer expectations continue to rise, organisations that can predict churn, personalise interventions, and measure impact gain a clear competitive edge.
By combining experience data, AI-driven feedback analytics, and predictive insights at every level of the organisation, churn analysis becomes more than a defensive measure. It becomes a growth driver.
The message is clear: the future of retention belongs to those who act on insight, not instinct. Are you ready?

Launch Smarter CX with Staffino Core
Start collecting customer feedback, managing responses in real time, and visualising what drives satisfaction. Build experiences that make people come back. All in one core solution.
FAQ
The most important data for churn analysis includes experience data (CSAT, NPS, CES, and customer feedback), behavioural and operational data (purchase frequency, usage patterns, support interactions), and employee and process data (frontline performance and service compliance). When combined, these data sources enable accurate customer churn analysis and the creation of a reliable customer health score.
Customer churn is predicted using AI by analysing historical customer behaviour, experience metrics, and operational data to identify patterns that typically precede churn. Machine learning models assign churn risk scores to individual customers, allowing businesses to take proactive, personalised retention actions before customers leave.
A customer health score is a composite metric that combines experience, behavioural, and operational indicators to measure the likelihood of customer retention or churn. It helps prioritise high-risk customers and supports more effective churn analysis and intervention strategies.
Customer churn analysis should be performed continuously or at regular intervals, depending on data availability. Real-time or near-real-time analysis is most effective, as it enables early detection of churn signals and timely retention actions.
Common KPIs include churn rate, retention rate, customer lifetime value (CLV), customer health score trends, and improvements in NPS or CSAT. Financial metrics such as revenue retained and cost savings from reduced churn are also critical for evaluating impact.