Ever sent out a survey and heard… nothing? You’re not alone. Whether it’s a customer feedback form or an employee survey, getting people to respond is harder than ever. But response rates aren’t just vanity metrics—they’re the backbone of reliable, actionable insights. They determine the reliability of your data and the effectiveness of your feedback strategies. So, what is a good response rate for a survey, really?
Let’s break down the benchmarks, explain how to calculate the response rate of a survey, uncover what’s holding people back, and explore how to increase survey response rates.
How to Calculate Survey Response Rate?
A survey response rate is calculated by dividing the number of completed surveys by the number of surveys distributed, then multiplying by 100 to get a percentage.
Formula:
(Number of Completed Surveys / Number of Surveys Sent) × 100 = Response Rate (%)
For instance, if you send out 1,000 surveys and receive 200 responses, your survey response rate is 20%.

Transform Your Customers' Experiences
Create a bulletproof customer journey with tailored CX products and services that will foster loyalty and reduce churn.
Average Survey Response Rates
The average survey response rate can vary significantly based on the type of customer survey, distribution method, and target audience. Here are some average response rates across different survey types:
- Net Promoter Score (NPS) Surveys: Approximately 18%
- Customer Satisfaction (CSAT) Surveys: Around 14%
- Customer Effort Score (CES) Surveys: Approximately 29%
- Visual Rating Surveys: Around 22%
- Custom Format Surveys: Approximately 10%
These figures are based on internal and external research and can serve as general benchmarks.
What Is a Good Response Rate for a Survey?
Now the question everyone’s asking: what is a good survey response rate? Determining a “good” survey response rate depends on various factors, including the survey’s purpose, distribution method, and audience. However, general benchmarks suggest:
- Excellent: Above 50%
- Very Good: 30% – 50%
- Average: 10% – 30%
- Low: Below 10%
It’s important to note that these are general guidelines, and acceptable response rates can vary by industry and survey type.
What Is the Minimum Acceptable Survey Response Rate?
While there’s no universally accepted minimum, a response rate below 10% is often considered low and may not provide reliable insights. Ensuring a higher response rate enhances the credibility and usefulness of your survey data.
Factors Influencing Survey Response Rates
Several elements can impact your survey’s response rate:
1. Survey length
Shorter customer satisfaction surveys (ideally under 5 minutes) tend to have higher completion rates.
2. Timing
Sending surveys promptly after an interaction or during the most “active” hours/days can increase relevance and response rates.
3. Personalisation
Customised invitations addressing the recipient by name can enhance engagement.
4. Incentives
Offering rewards, such as discounts or loyalty points, can motivate survey participation.
5. Mobile Optimisation
Ensuring CX surveys are mobile-friendly caters to users on various devices.
How to Increase Survey Response Rates: 7 Proven Strategies
To increase your survey response rates, consider implementing the following tactics:
1. Offer Incentives
Incentives can be powerful motivators. These don’t always have to be monetary, although discounts, vouchers, or loyalty points are popular.
For example, a retail brand might offer a 10% discount on the next purchase after completing a short customer survey. Even non-monetary rewards, like entry into a prize draw or early access to a new product, can significantly boost participation. Just make sure the value feels relevant and fair for the time invested.
2. Keep Surveys Concise
Respondents are more likely to complete a survey if it only takes 2–5 minutes. Long, repetitive, or overly detailed surveys can lead to drop-offs or rushed, unreliable responses.
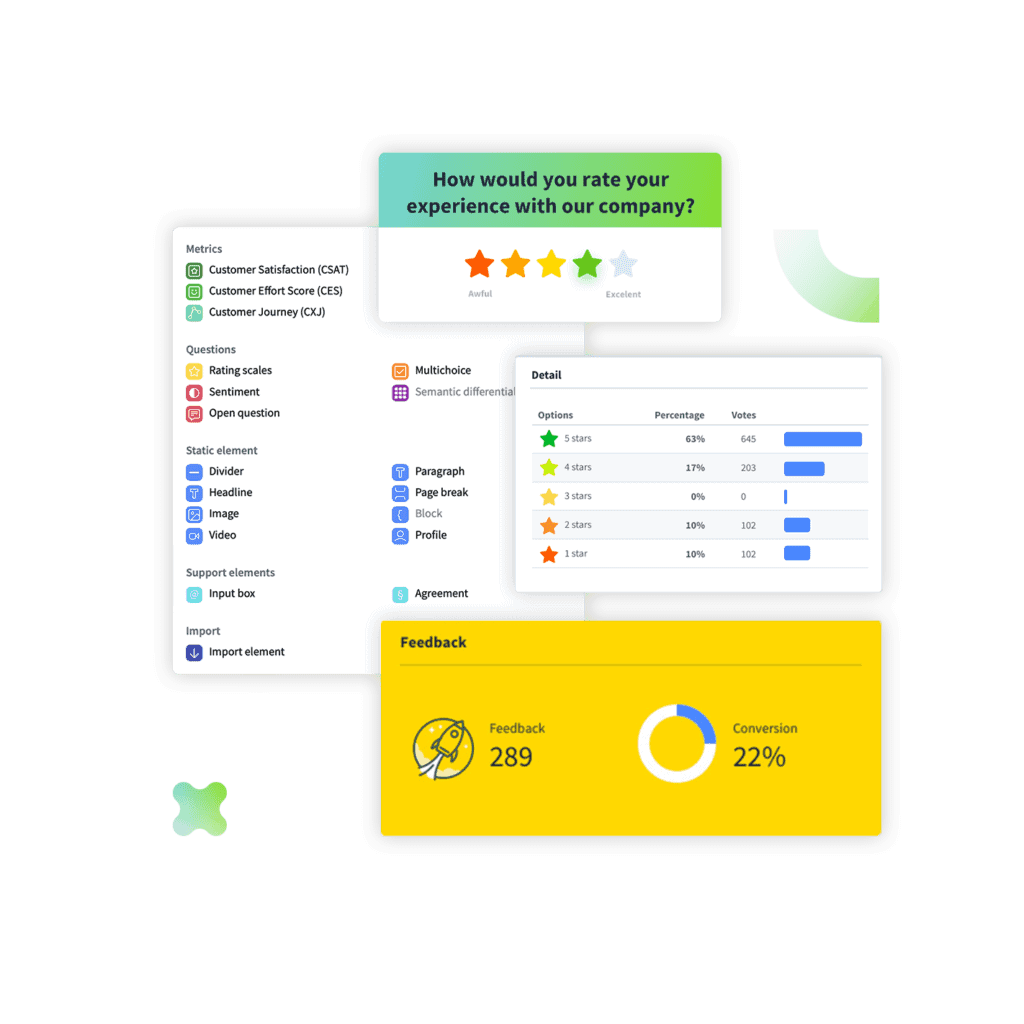
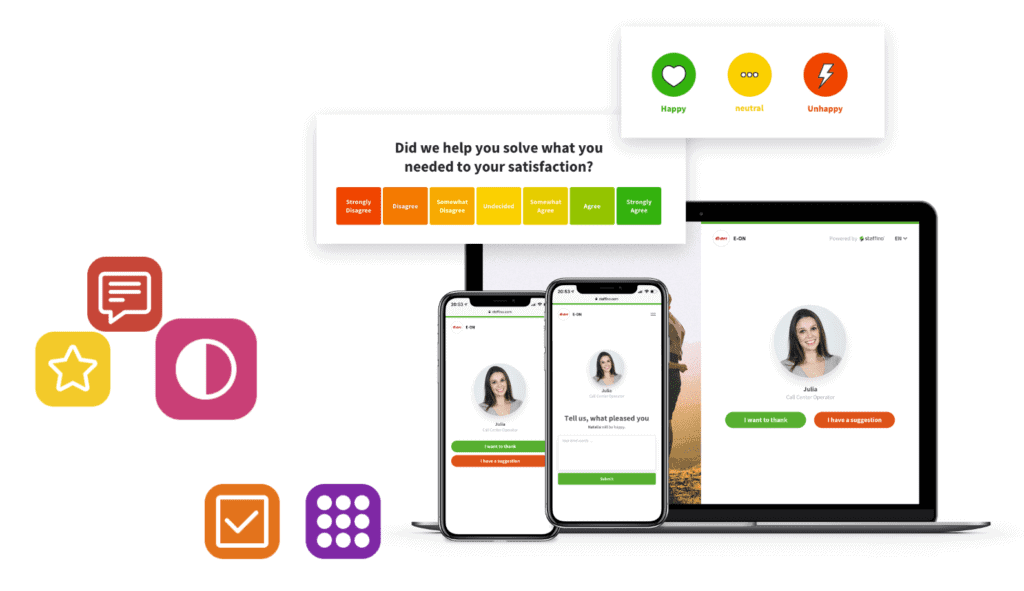
Focus on what you really need—each survey question should have a purpose. For example, instead of asking ten similar satisfaction questions, use a single CSAT score with an optional comment box to gather qualitative feedback. Tools like Staffino’s NPS or emoji-based surveys help collect valuable input with minimal effort required from the customer.

Boost Customer Experience with NPS, CSAT & CES
Get the most accurate and actionable insights into your customer satisfaction with Staffino's CX metrics. With automated surveys and effective reporting, you can quickly gain valuable insights into your customer journey.
3. Personalise Communications
A generic “Dear Customer” email gets ignored more often than you’d like to believe. Instead, addressing recipients by name and referencing their specific purchase or interaction (e.g., “Hi Anna, thanks for visiting our Bratislava store yesterday”) builds trust and relevance.
You can also customise customer survey questions based on the type of service or product used. This shows customers that you’re not just after generic feedback—you care about their unique experience.
4. Optimise for Mobile
With more than 50% of emails opened on mobile devices, if your survey isn’t mobile-friendly, you’re losing a big chunk of potential respondents. Use responsive design and ensure your survey buttons, text, and images scale properly on different screen sizes.
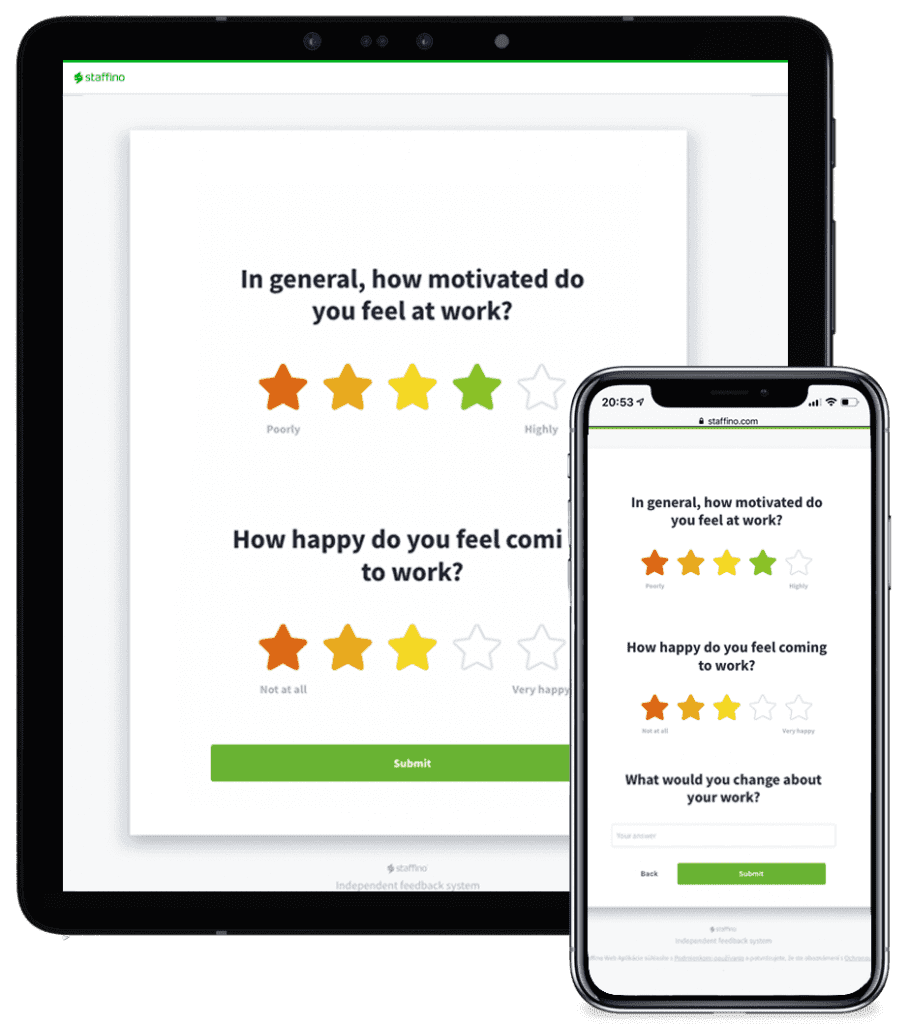
Staffino can automatically optimise your customer or employee satisfaction surveys for mobile and tablet, so users can provide feedback while commuting, waiting in line, or even scrolling in bed—no excuses.
5. Send Timely Reminders
Sometimes people forget, and a gentle nudge is all it takes. A follow-up email or SMS reminder, ideally sent within 24–48 hours after the initial invite, can increase response rates significantly.
For example, our clients have seen success by scheduling a reminder a day after a transaction-based survey was sent. Just make sure your reminder is polite, non-spammy, and includes a direct link to the survey.
6. Ensure Anonymity
If people feel they’re being judged or monitored, they may hold back. Clarify up front that responses are anonymous, especially for employee surveys or sensitive topics like complaints.
In HR or EX surveys, anonymity can increase honesty and boost participation. For example, an employee might feel more comfortable criticising management practices if they know it won’t be traced back to them.
7. Communicate Purpose
Telling people why their feedback matters increases the chance they’ll participate. Include a short intro that explains what the survey is for and how the insights will be used.
Example: “Your feedback helps us improve our delivery service and ensure faster, more accurate deliveries next time.” If you’ve implemented changes based on past customer experience surveys, share that too—it builds trust and shows that the survey isn’t going into a black hole.
How Our Clients Improve Their Survey Response Rates with Our CX Platform
The Staffino CX platform is successfully enhancing the survey response rates for over fifty local and international companies.
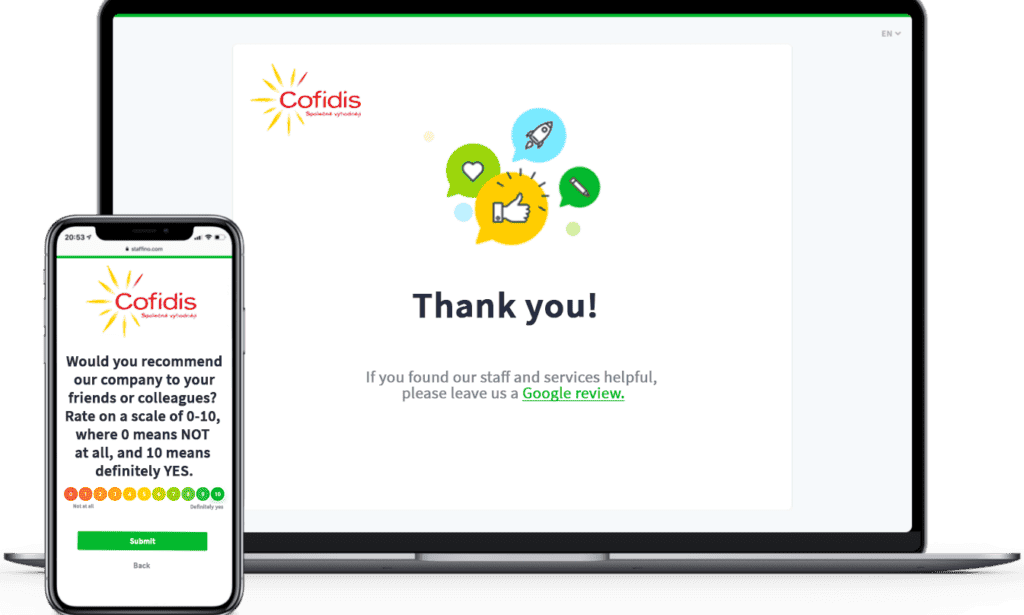
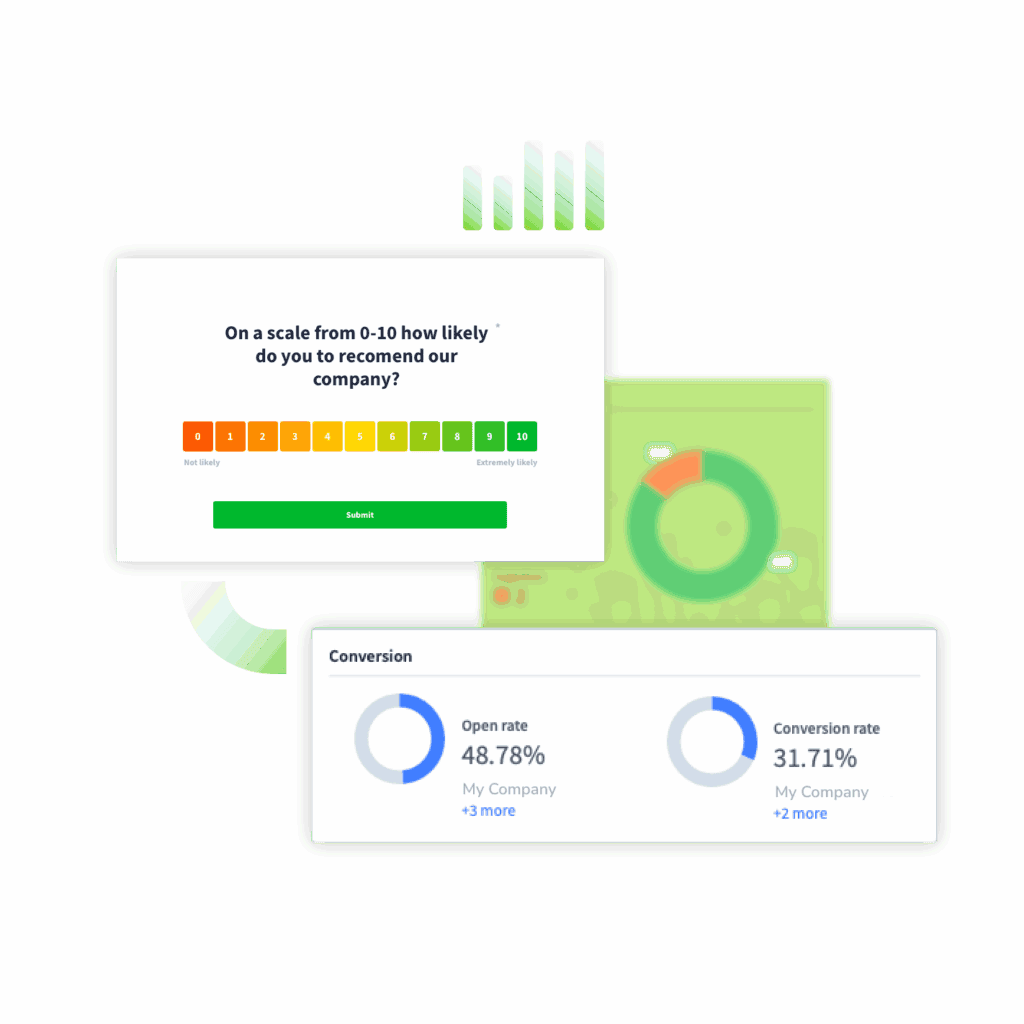
For instance, Cofidis Czech Republic achieved an impressive 24% conversion rate on their email feedback campaigns, significantly surpassing the typical survey response rate for commercial businesses, which ranges from 6% to 12%. This success is attributed to our platform’s user-friendly design, effective distribution methods, and the strategic questions designed by our CX consulting experts. Read the full case study here!
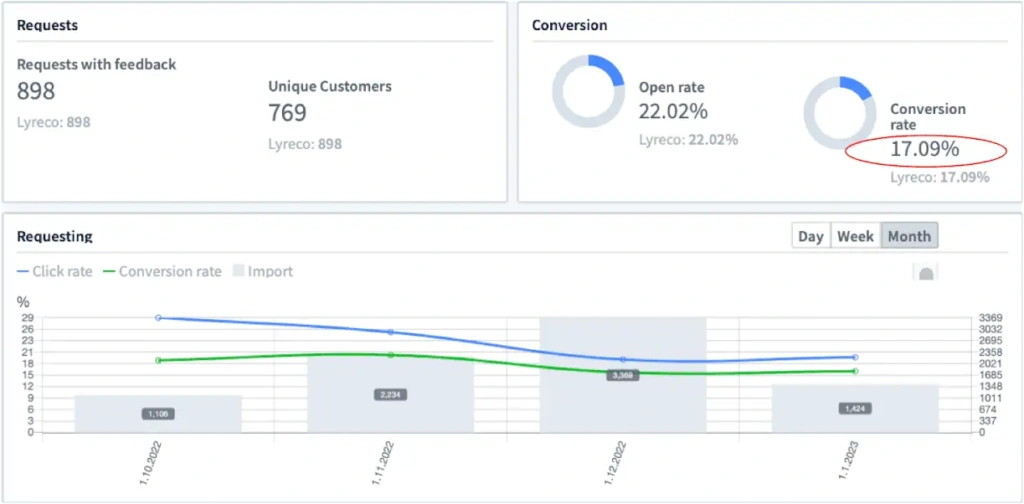
Lyreco Central Europe, a global leader in workplace supplies, used Staffino’s platform to drive customer-centric transformation, and the results speak for themselves. By launching targeted transactional surveys across Slovakia, Lyreco achieved an outstanding conversion rate of 17.09%, proving that strategic CX management can significantly lift engagement and response rates. Read the full case study here!
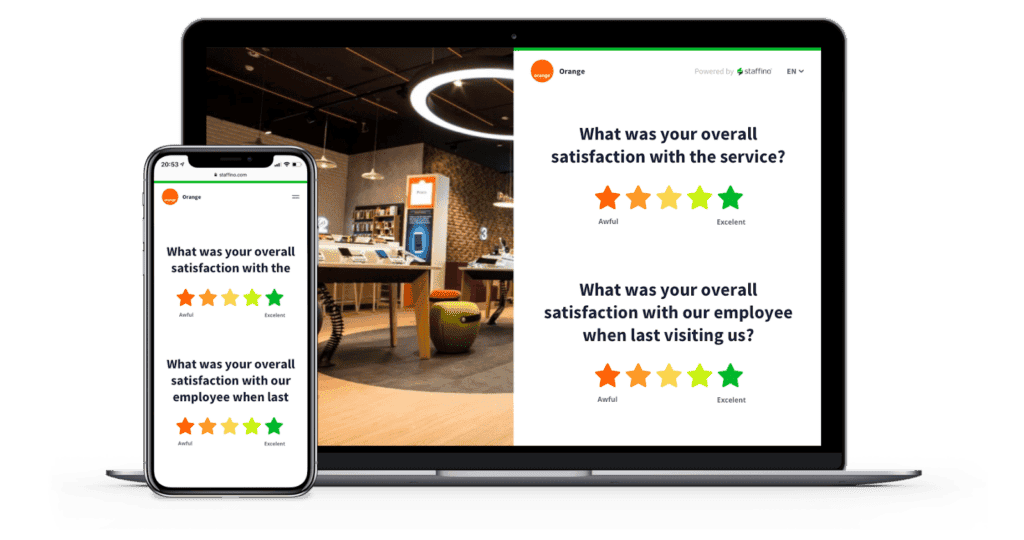
Similarly, Orange Slovakia utilised Staffino’s platform to collect feedback from over 562,000 customer interactions, resulting in more than 38,000 responses. This substantial volume of feedback enabled them to identify and address customer issues proactively, leading to a 70% success rate in retaining customers who were likely to leave. Read the full case study here!
These examples demonstrate how our customer experience management platform facilitates higher engagement rates through personalised surveys, timely distribution, and actionable insights.

Discover How Brands Succeed with Staffino!
Learn from real-world success stories! See how Staffino has helped other businesses reach their goals and get inspired to take your business to the next level.
Where Can You Find the CX Survey Response Rate Report in Staffino?
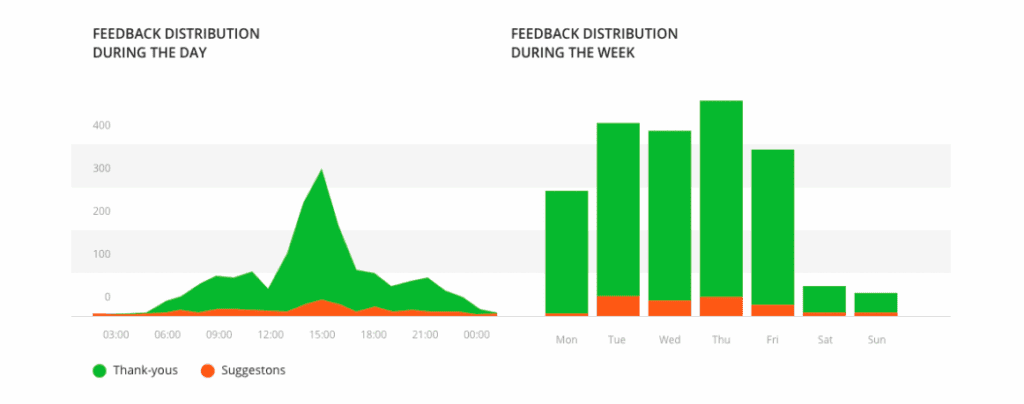
To access your survey response rate report in Staffino, log in to your user account, navigate to the ‘Distribution’ section, and view the tab ‘Performance’ with the response rate graph.
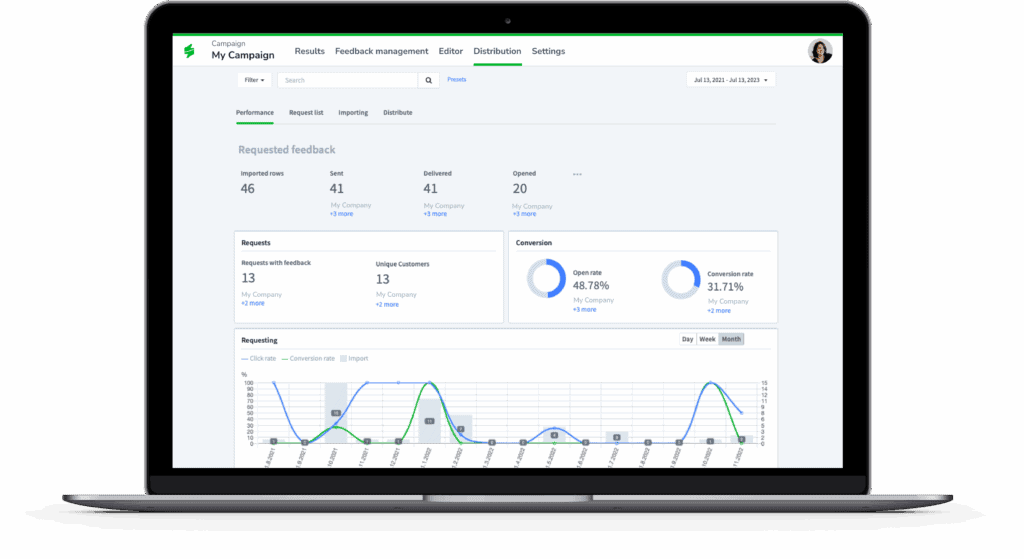
This feature provides a clear visualisation of your survey performance, helping you monitor and improve your response rates effectively.
Start Improving Your Survey Response Rate Today with Staffino!
Understanding and improving your survey response rates is essential for gathering meaningful insights. By recognising average benchmarks and implementing strategies to enhance participation, you can ensure your surveys yield valuable data to inform decision-making.
Staffino is ready to increase your survey response rates and gather the meaningful insights necessary to drive business improvement. With our innovative feedback management platform and strategies, you can easily understand and enhance your survey participation, ensuring you receive valuable data to inform your decision-making.
Get a First-Hand Experience Today!
Staffino is the perfect tool for creating engaging surveys, tracking performance, responding to customer feedback, and rewarding top employees. Get started today with our FREE demo!